No strong forecast signal for much of the country
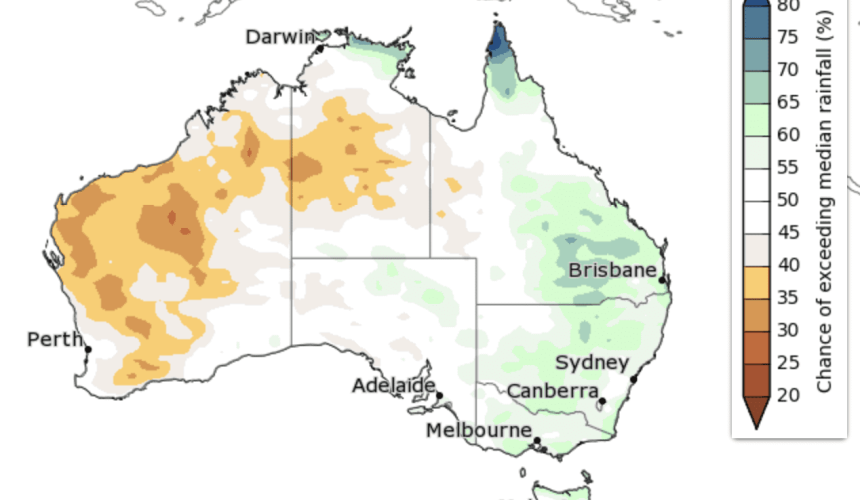
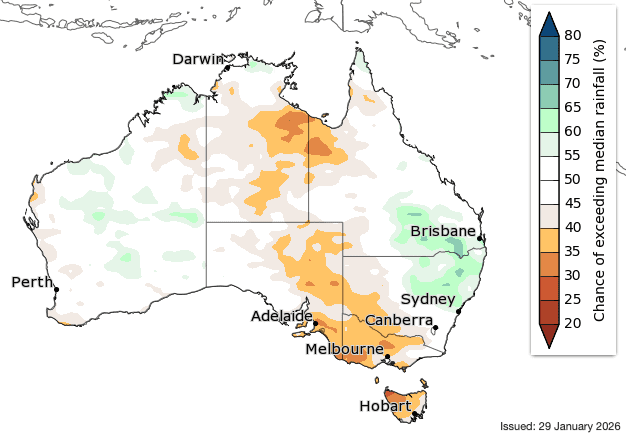
- For large parts of Australia, the rainfall forecast does not strongly favour any outcome, meaning there are roughly equal chances that February to April rainfall will be above, below or close to average.
- Rainfall is likely to be below average (60 to 75pc chance) for parts of south-eastern, central and northern Australia. The drier than average forecast signal varies in strength and location from month to month as the season progresses.
- Rainfall is likely to be above average (60pc to 70pc chance) for parts of south-east Queensland and north-east New South Wales
- February to April falls within the wet season for northern Australia when high-impact rainfall events regularly occur. There are increased chances of above average rainfall during March across parts of eastern Queensland.
Outlook video
TEMPERATURE
Warmer than average days and nights likely across most of Australia
- Maximum temperatures are likely to very likely to be above average (60pc to over 80pc chance) across most of Australia.
- The chance of above average maximum temperatures is closer to 50pc across much of the north during March, reflecting the forecast for wetter conditions and increased cloud cover.
- Some areas have an increased chance of unusually high maximum temperatures1 (over 50pc chance), including Tasmania, much of Western Australia, and parts of the east.
- Minimum temperatures are very likely to be above average (more than 80pc chance) across most of Australia, with lower chances (closer to 50pc across parts southern Australia.
- There is an increased chance of unusually high minimum temperatures1 (over 50pc chance) across much of northern and eastern Australia, with the strongest chances in the tropical north and parts of the east (over 70pc chance).
1Unusually high maximum and minimum temperatures are those in the warmest 20pc of February to April days and nights, respectively, between 1981 and 2018.
COMPARISON
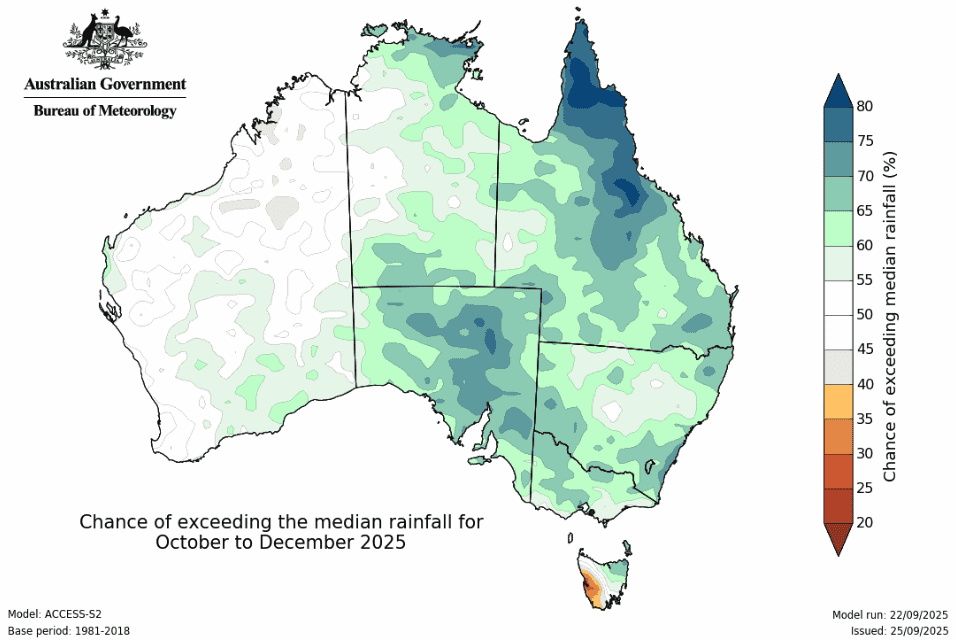
Previous three-month outlook versus actual rainfall received
October to December 2025 rainfall outlook (issued 29 September 2025):
October to December 2025 rainfall deciles:
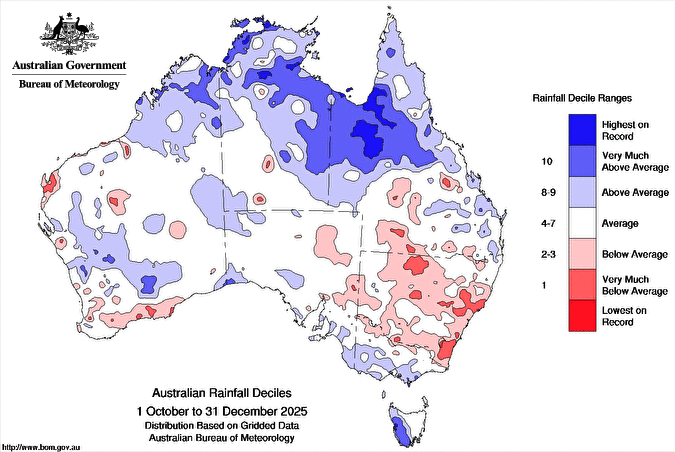
Source: BOM
From a public relations perspective, the worst thing that BOM does is put the maps in colour code. People look at it and see green and blue and think it means it is going to rain, without bothering to check what the colours mean (for example light green indicates there is a 60% chance of being wetter and therefore 40% chance of being drier).
Great to see Beef Central continuing to publish the BOM’s rainfall prediction map (higher or lower than average) versus the map of what actuality fell compared to average. It appears to me that BOM’s predictions are less than 20% correct. That’s at least 80% incorrect. Many Australian businesses use the BOM’s prediction for their forward planning. Imagine the total cost to sectors including agriculture, tourism and mining when they forward plan based BOM’s prediction. Is it time for an independent review of why we are spending taxpayers dollars to get such consistently incorrect predictions, and how much it’s costing Australian businesses that use these predictions?